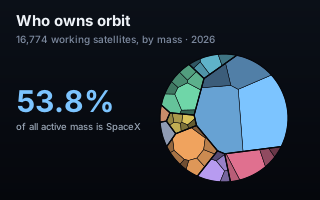
One company is over half of everything alive in orbit
There are 16,774 satellites catalogued as working, weighing 11,403 tonnes between them. One operator accounts for 6,130 of those tonnes. Counted by headcount the concentration is starker still: 11,091 of the objects belong to the same company.
Mass, not headcount
Satellite charts almost always count objects, which flatters constellations of small spacecraft and understates a handful of large ones. This one sizes every cell by mass in orbit, which is the harder and more honest measure of what is actually up there. Both numbers are on the chart, and the gap between them is informative on its own: SpaceX is 53.8% by mass and 66.1% by count.
A standard treemap would be correct and forgettable — nine grey boxes subdivided into thirty-nine smaller grey boxes. A Voronoi treemap packs the same hierarchy into organic cells inside a boundary, and reads as one picture rather than a grid. Area is still the value, to within a fraction of a percent.
The boundary itself then morphs between five outlines — circle, scalloped, hexagon, pentagon, squircle — re-tessellating each time on identical data. It is not decoration: watching the same quantities re-pack into a different container is a fast way to understand that area, not shape, is what encodes the number.
The two settings that decide whether it is honest
A weighted Voronoi solver has a minimum weight ratio that clamps how small a cell may get. Left at its default, the smallest cells in this dataset were drawn 246% larger than their true value — the chart would have looked fine and been wrong. It is set to 0.0008 here, and the convergence tolerance tightened to match, so every cell's area is its value.
The solver is also seeded with a fixed PRNG, so the layout is reproducible rather than different on every load. Anyone can re-run it and get the same picture.
What the chart does not claim
Mass in the catalogue is partly estimated by the cataloguer, and "active" is his judgement rather than a telemetry fact. Starshield is counted to the NRO, which operates it, rather than to the company that builds it. All three are stated in the chart's notes, because a 53.8% headline deserves to be read alongside the definitions that produce it.
What your data needs to look like
A two-level tree: a group, a leaf, and a value on each leaf.
owner
orbital_shell
mass_tonnes
count
SpaceX
53° shell
2781
5012
China
Sun-synchronous
312
388
Novice tip: this form is at its best with 5–9 groups, 30–60 leaves, and one group big enough to be the story. Fewer and a bar chart wins; many more and the cells get too small to label.
The takeaway
Concentration is easy to assert and hard to feel. "One company holds half of orbital mass" is a sentence. A single cell taking up half the frame, and staying half the frame as the frame changes shape five times, is an argument.