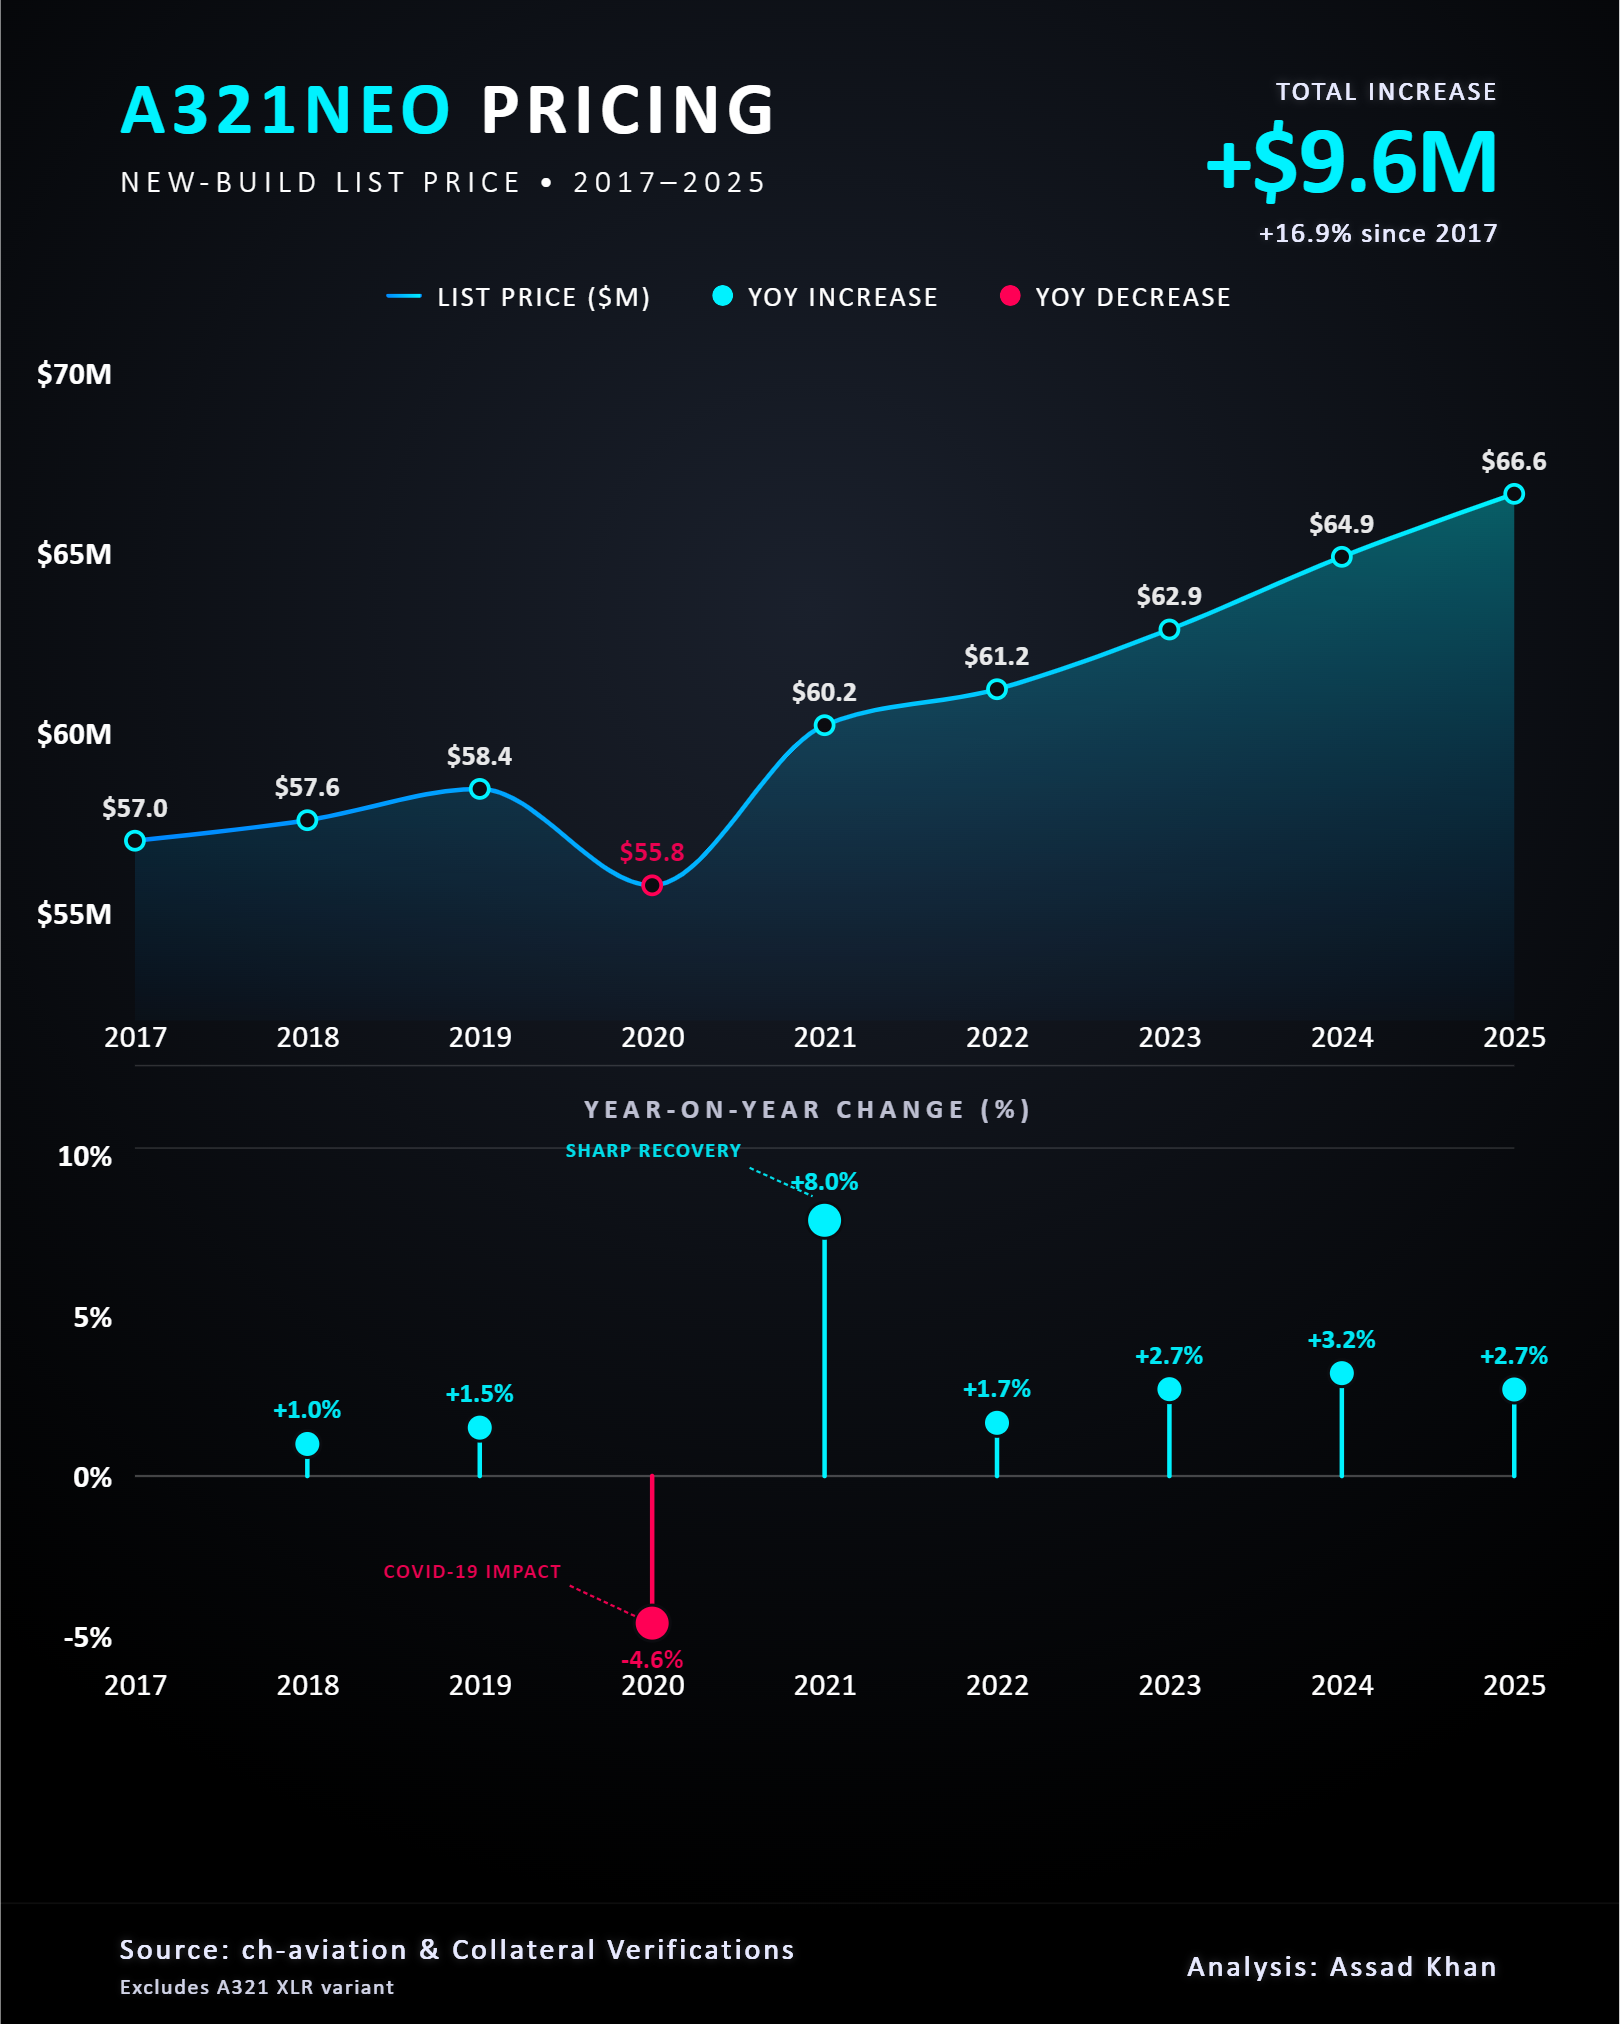
The current market value of a new A321neo climbed roughly 17% between 2017 and 2025 — through a pandemic that grounded half the world's fleet. Here's what that number actually measures, and why it kept rising.
Most people quote the wrong number for what an aircraft is "worth." They reach for the list price — the manufacturer's published sticker — which almost nobody actually pays, and which tells you nothing about the state of the market. The number that matters to a lessor, a financier or an airline treasurer is the current market value.
Current market value, not list price
Current market value (CMV) is the price a willing, able buyer and a willing, able seller would agree for a specific aircraft, in an open and unforced transaction, at a single point in time. It moves with the real world: order backlogs, engine availability, fuel prices, interest rates, and how badly airlines want the type right now. List price does none of that — it's a headline, discounted heavily behind closed doors.
So when we chart the A321neo below, we're tracking the current market value of a new aircraft year by year — the number that reflects genuine demand, not a brochure.
A321neo new-aircraft current market value, 2017–2025. Open the interactive version → Source: ch-aviation & Collateral Verifications. Excludes the A321 XLR variant.
The story in three acts
2017–2019 — steady appreciation. Value edged up from about $57.0M to $58.4M as the neo backlog swelled and airlines rushed to re-engine their narrowbody fleets. Nothing dramatic; a healthy asset holding its ground.
2020 — the only fall on the chart. Value dropped 4.6% to $55.8M as the pandemic collapsed near-term demand. Notably, it was the only down year — and a shallow one. A widebody in the same window lost far more, because its recovery path was longer and thinner.
2021–2025 — the recovery premium. Value snapped back nearly 8% in 2021 alone, then climbed every year to $66.6M by 2025 — a net gain of $9.6M, or about 17%, over the run. Narrowbodies led the recovery, and the A321neo led the narrowbodies.
Why this asset, specifically
A multi-year backlog. When the order book stretches years out, a delivery slot you can use now carries a scarcity premium — that props up the value of an available airframe.
Range that opened new routes. The A321neo family stretched the narrowbody mission into long, thin markets that used to require a widebody, widening the pool of buyers competing for the same jet.
Constrained supply. Engine availability and production ramp limits kept new deliveries tight — and tight supply holds values firm.
Fuel economics. With every fuel-price spike, a new-generation narrowbody's operating advantage widens, and so does what an operator will pay to secure one.
Why the chart is built the way it is
Two panels, one story. The area chart carries the value line with the actual figure printed above each year, so you never have to estimate off an axis. Below it, a lollipop panel shows the year-on-year change — green for a rise, red for the single fall — so the 2020 dip and the 2021 rebound read instantly. The headline "+$9.6M / +16.9%" is computed from the underlying series, never typed. That discipline — the number on the chart is always the number in the data — is the whole point.
What your data needs to look like
The simplest shape there is: one row per time period, one value column. That's the whole input.
year
market_value_usd_m
2017
57.0
2018
58.4
2020
55.8
Novice tip: bring the level — the value in each period — not the year-on-year changes or the percentages. The agent computes every delta, the headline figure and the up/down colours from your raw numbers. Two clean columns and you're done.
The takeaway
A new A321neo appreciated through the worst demand shock in aviation history. That's not a quirk of one aircraft — it's what happens when a scarce, efficient, flexible asset meets structural demand. And it's only visible if you track the right metric: current market value, not list price.
Have a fleet, values or traffic dataset you want read this clearly? Drop it into the AK.VIZ agent for three chart proposals on your real numbers, see more of the work, or read about bespoke commissions.